
Projects

-
How (and Why) to Stop Users from Selecting Text on Your Website
I recently needed to prevent a page from having selectable text. I remember in the “old days” of the Internet there were all sorts of elaborate, mostly Javascript-based workarounds, that would block people from highlighting text. Today, it’s much easier, with the CSS property
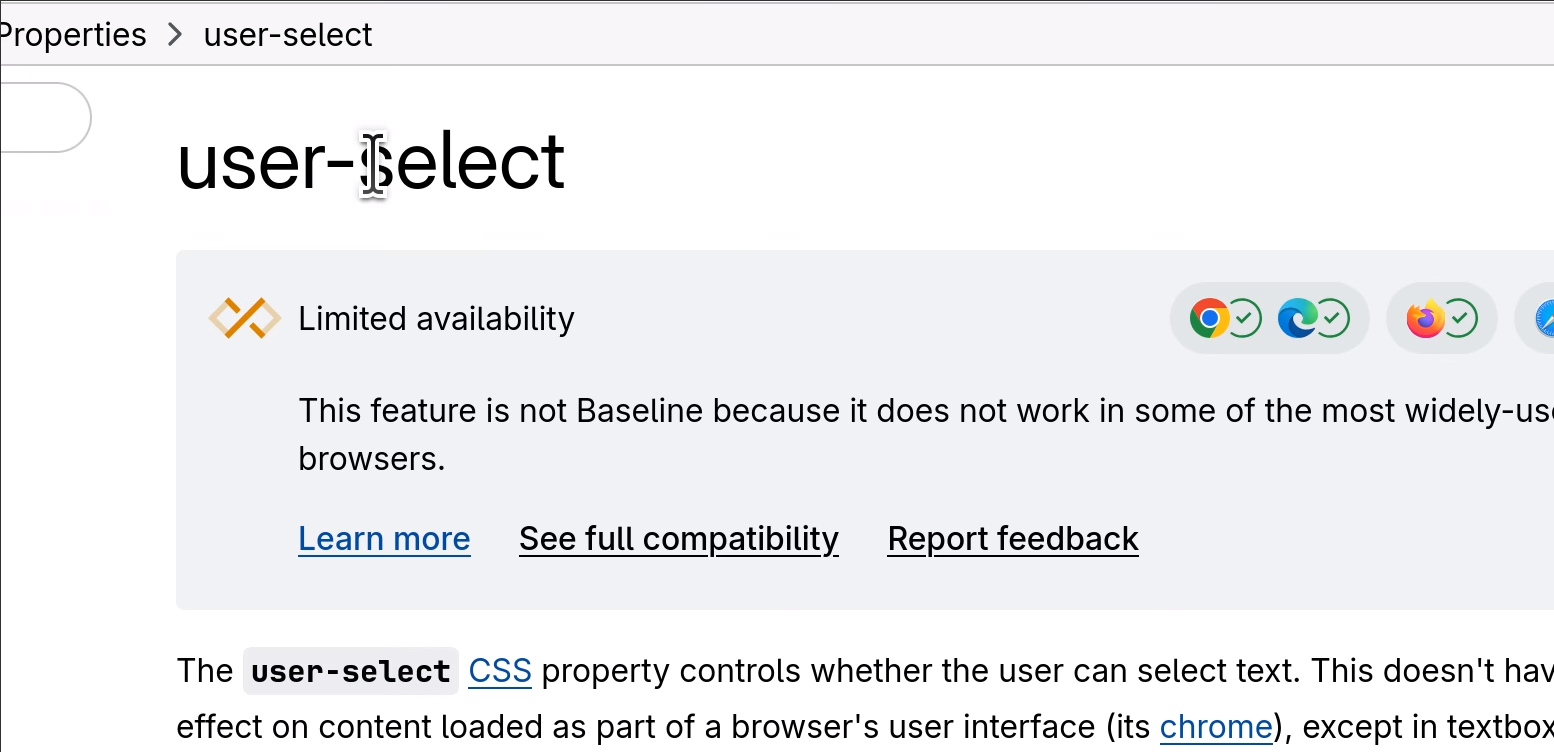
user-select:none. This was apparently (according to this StackOverflow answer) in the CSS3 spec, then removed from a later spec, then put back in to the current spec, and is now supported by all major browsers except Safari.Here’s a demo, courtesy of MDN:
.unselectable { user-select: none; } .all { user-select: all; }<p>You should be able to select this text.</p> <p class="unselectable">Hey, you can't select this text!</p> <p class="all">Clicking once will select all of this text.</p>And here’s how it looks:
You should be able to select this text.
Hey, you can't select this text!
Clicking once will select all of this text.
Obvious caveat: If you are using this to “stop people from copying the content on this page,” don’t. That is not how the Internet works. That’s not how any of this works. Stop doing this.
Here are some examples, courtesy of CSS-Tricks, where it might be OK to disable text selection, although as I just said, I disagree about paywalled content theft, simply because this just does not work as a security measure.
For my part, I’m designing a web app that will run in kiosk mode on a touch screen, and without the
user-select:nonespecifier, a user could accidentally drag on the screen, inadvertently highlighting text. I also am intrigued by the idea of using user-select:none to remove asides and other non-text content (such as code line numbers–ooh) although it’s probably overkill for most uses. Anyway, I’m glad to have a new tool in my CSS toolbox! -
Automating Stuff the 'Easy' Way With anacron

cronis a wonderful tool for running tasks on a schedule. Set it once, and then forevermore on your schedule,cronwill handle repeatedly doing the thing.Unless your computer is off!
cronwas originally designed for mainframes that never are turned off. If you have a task scheduled to run every day at midnight but your laptop is closed every night,cronwill never run the task.1I recently learned about
anacron, which solves this problem by running things at a “scheduled-ish” time. Instead of specifying a time, you specify a frequency (hourly, daily, weekly, etc). When anacron starts (when your computer wakes from sleep/etc) if it’s been more than the specified time since it last ran, it runs. Simple, right?Eh, not so much. Possibly because I had some complicated things I wanted to set up, getting everything aligned and working took almost a week (admittedly because I was waiting for
anacronto run and wasn’t interested in force-scheduling it).My main problem was that I wanted
anacronto run as me, rather than as root. By default, unlikecron,anacrononly runs as root.I wanted to set up
urlwatchto keep an eye on some websites, using headless Chrome. Automatically hitting a website as root seems like not a great idea? So running as a non-superuser seemed like the way to go.Here’s what I did:
Setup
First, get
anacron. If you have a Red Hat system, you already have it as part ofcronie. On Ubuntu-based distros, you may have to install it. On a Mac, there is no official support foranacronand you are recommended to uselaunchd. On the other hand, there’s this Macports option with all of 12 installs 😬 which I probably will not be trying.Then, I followed the steps in this Opensource.com article to configure
anacronto run as my user. To summarize that article in my own words:-
Create a test script to practice on. My example script looked like this:
  #!/bin/bash
  echo $(whoami) >> ~/dontyouknowwhoiam.txt
This should prove that anacron is running as me (which I still wasn’t 100% confident of until testing it).
-
Create local directories that we’ll point
anacronto instead of the system directories:mkdir -p ~/.local/etc/cron.daily ~/.var/spool/anacron -
Create a local configuration file at
/.local/etc/anacrontab:SHELL=/bin/sh PATH=/sbin:/bin:/usr/sbin:/usr/bin #replace with your full $PATH. anacron doesn't have access to system environment variables set in, say, ~/.profile. 1 0 cron.mine run-parts /home/{user}/.local/etc/cron.daily/This will run everything in the
~/.local/etc/cron.dailyfolder every 1 day, waiting 0 minutes after the computer starts up. The buffer can be helpful if you’re running heavy scripts, I assume. Themineis an arbitrary string to distinguish fromcron.dailyorcron.weeklyetc.As an aside,
anacrontabis a perfectly logical name for the scheduling file belonging toanacron.cronhas acrontab(short for cron table), and soanacronhas ananacrontab. But for an elder millennial like myself, this was inevitable:
I’m so sorry. (Not really)
-
Tell our computer to run
anacronon a schedule. The article suggests adding this line to your~/.bash_profile:anacron -t /home/{user}/.local/etc/anacrontab -S /home/{user}/.var/spool/anacronThis manually triggers
anacronwith the local anacrontab, and use your local spool file (which is whatanacronuses to keep track of the last time it ran). Putting it in your ~/.bash_profile means thatanacronwill check for new jobs every time you restart your computer.Putting it in ~/.bashrc (or sourcing the profile file from rc) will run it when you open a new terminal window. Finally, putting it in your
crontab:0 0 * * * anacron -t /home/rachel/.local/etc/anacrontab -S /home/rachel/.var/spool/anacronmeans
anacronwill also check for new jobs at midnight, in case your computer hasn’t been off. I used all three options, because what’s the harm. Worst case, anacron decides that it hasn’t been long enough since it last ran and goes back to sleep.
Those are the basic steps. That said, I ran into at least one bump on the road to better automation.
It’s not stated anywhere but the man page, but
run-partshas fairly specific naming requirements for executables, for it to run them. In default mode, according to the man page,the names must consist entirely of ASCII upper- and lower-case letters, ASCII digits, ASCII underscores, and ASCII minus-hyphens.
You can check that
run-partsis happy withrun-parts --test /home/{user}/.local/etc/cron.daily.Then I had to get
urlwatchup and running. I’m going to save that for a separate post, because (as usual) I’ve gotten a little verbose. Up next (eventually): how to configureurlwatchto check for changes to websites on a schedule!-
Unless your laptop is like mine and “forgets” to sleep when the lid is closed, which is a whole other hilarious problem. ↩
-
-
Marking 4 Years at Attentive 🎉
Today (okay, tomorrow if you’re being pedantic) marks my four-year anniversary at Attentive. I started thinking I’d learn a lot about the infrastructure that powers SMS sending over the internet at scale. Haha, wrong, that’s actually a completely different team and besides from a software perspective it’s basically just API calls.
Instead, I learned a whole new programming language (nobody told me in my interview that Attentive was primarily a Java shop!) and made a whole bunch of new friends. Seriously, my coworkers are the greatest. Oh, and I got promoted. Three times.
My main source of income prior to switching to software engineering was, except for a brief stint on staff at an online magazine, primarily through freelance writing and editing. And while I had many long-term clients that were happy with my work and that I worked with for more than four years, I still feel like four years in a job at the same company carries more weight.
I’m celebrating this meaningful milestone by making a donation to Unidos MN, a grassroots organization focused on immigration, education and climate justice in Minnesota. Seemed like the right time.
-
Why I Switched to git switch
When I first learned1 git, I learned that to stop working in the current branch and to start working in a new branch, the command was
git checkout branchname. Or to create a new branch,git checkout -b branchname.All the way back in 2019, though, the git team released
git switch, which is supposed to replacegit checkout. (Don’t worry,checkoutisn’t going anywhere.) And finally, this year, I retrained my muscle memory to usegit switchinstead ofcheckout. Why is switch better?-
checkouttries to do too many things.git checkout <branchname>is valid, as isgit checkout <hash>, as isgit checkout -- path/to/file. These all do different things. Checking out a *branch means “start working on this branch.” Checking out a commit hash puts you in “detached HEAD” state, the source of many a developer’s footgun.2 Checking out a file reverts it to a previous state (usually to the state of the last commit).I’ve used all these use cases! Usually on purpose! But you have to admit it’s kinda confusing.
Also, if you have a file and a branch that have the same name, git has to decide which one you meant when you use
checkout. I’ve never come across this particular collision myself but I can imagine there are a non-zero number of git branches calledreadmeout there, which could lead to really unexpected results if you just typedgit checkout readmewithout looking closely at the output. -
The way to create a new branch with
switchis to use the-cflag, which means “create.” The way to create a new branch withcheckoutis to use the-bflag, which means “branch,” which is a tautology.
Basically, as I understand it, the git team felt that
checkoutdid too many things and was confusing for new users. All good reasons to split the command into two.Most important to me, however, is
git switch -which switches back to the previous branch, similar to other Unix-y commands, such ascd -, which takes you back to your previous directory.As always, saving like two keystrokes is the only thing I care about. Efficiency!
-